Category Archives

18 Articles

Posted by Anna Brandt on

layout tab

Release 1.7.1

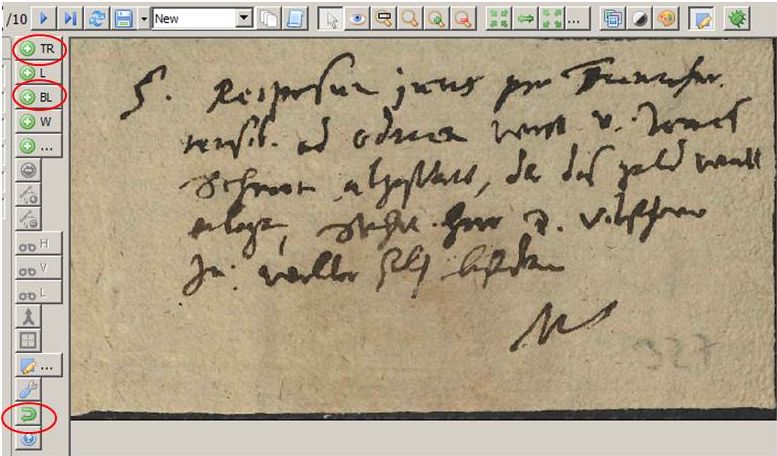
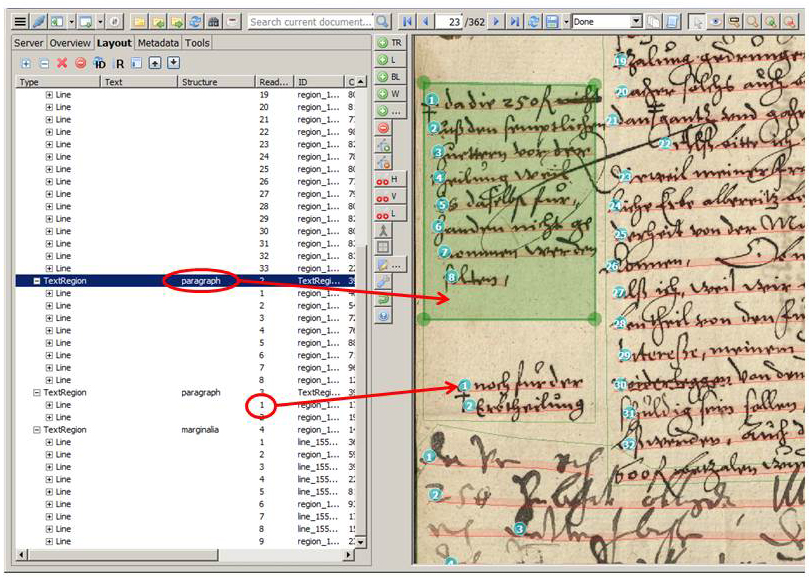
If you correct the automatic layout analysis, you can do this directly in the image or navigate via the layout tab on the left side. There are all shapes, like the textregions and the baselines, displayed with their position in the image and their structural tags. It is possible to delete or move shapes. In the image you can always see where you are at the moment, which element is currently marked – thus what you can change.

If you want to merge two baselines, just mark them in the layout tab instead of trying to hit the thin line in the image.

The navigation in the tab is especially useful if you want to see the complete image in the right window. This way you keep a better overview, because everything in the image and in the tab will be changed at the same time.

Tips & Tools
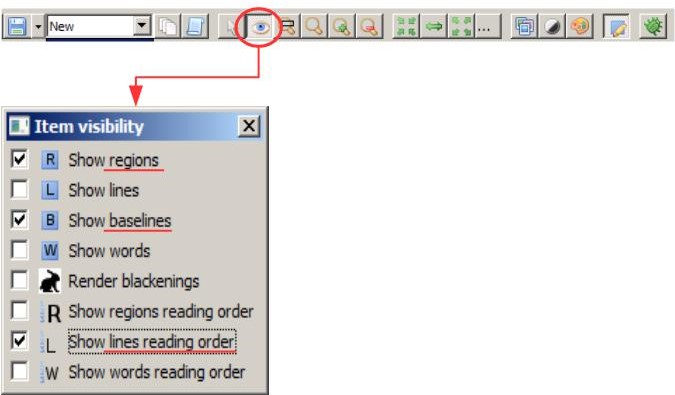
You can change the reading order of the baselines in the layout tab either by moving the lines or by clicking and changing the number in the column “Reading Order”.

Posted by Dirk Alvermann on

mixed layouts

Release 1.7.1

The CITlab Advanced Layout Analysis handles most “ordinary” layouts well – in 90% of the cases. Let’s talk about the remaining 10%.

We already discussed how to proceed in order to avoid trouble with the Reading Order. But what happens if we have to deal with really mixed – crazy – layouts, e.g. concept writings?

With complicated layouts, you’ll quickly notice that the manually drawn TRs overlap. That’s not good – because in such overlapping text regions the automatic line detection doesn’t work reliably. This problem is easily solved because TRs can have shapes other than square. They can be drawn as polygons and are therefore easily separated from each other.

It makes sense to add structural tags if there are many text regions in order to be able to distinguish them better. You can also assign them to certain processing routines during later processing. This is a small effort with great benefits, because the structural tagging is not more complex than the tagging in context.

Tips & Tools
Automatic line detection can be a real challenge here. Sections where you can already predict (with a little experience) that this won’t happen are best handled manually. For automatic line detection, CITlab Advanced should be configured so that the default setting is replaced by “heterogeneous”. The LA will now take both horizontal and vertical or skewed and oblique lines into account. This will take a little longer, but the result will be better.

If such complicated layouts are a continuous characteristic of your material, then it is worth designing a P2PaLA training course. This will create your own layout analysis model that is tailored to the specific challenges of your material. By the way, structure tagging is the basic requirement for such training.

Posted by Anna Brandt on

Toolbar – the most important tools and how to use them #2

Release 1.7.1

Correcting layouts

If the basic text regions are drawn, they can be edited. If you select one of the text regions, the other tools on the toolbar will be enabled.

With 1 you can add one or more points to the selected shape (TR or BL!). All shapes consist of dots and straight lines connecting them. You can edit the shape by moving the dots. You can use this tool to make a polygon out of the basic text region, whatever fits best to the text block. Press 2 to remove a dot from the selected shape. This tool is especially useful for correcting or shortening baselines.

This is especially useful if you have split elements. With 3,4 and 5 it is possible to cut a selected shape. This is also possible for both text regions and baselines: 3 cuts horizontally, 4 vertically. With 5 you draw your own line, which does not necessarily have to be horizontal or vertical.

The last important tool (red circle) is the Merge tool. This is especially important if the automatic LA has split baselines in the image. You can  use Merge to reassemble all shapes. So baselines with baselines and text regions with text regions. To do this you have to mark the corresponding shapes, which you can do directly in the image or in the layout tab.


Tips & Tools
When splitting, note that the TR and BL can only be cut where they have lines. It is not possible to cut through the dots.
Be aware that when you split a shape Transkribus will automatically change the Reading Order. For example, if two TRs are made from one, a new reading order is started in each TR.

Posted by Anna Brandt on

Reading Order

Release 1.7.1

The Reading Order displays the order in which the HTR will read the lines in an image. This RO is created automatically during the layout analysis, but can also be changed manually later. With the automatic LA, the RO is determined by the coordinates of the lines in the image: the top line, which is furthest to the left, is number one, and so on.

If the writing in the image is not completely horizontal or if baselines are split, this can cause errors in the Reading Order. If you correct the LA, you should always look at the RO again, otherwise the transcribed text gets confused and makes little sense. To change the RO you can either click on the circles at the lines where the line numbers appear and correct them directly. Or you can change the RO by selecting the corresponding line in the layout tab and moving it with the mouse. If the later full text is to make sense at first glance, such corrections are essential. After all, the RO determines the context of the content. If the HTR-Result of the document is only to be used for a full text search and is not to be displayed in structured full text, the RO is less relevant.


Tips & Tools
If you want to move a line forward or backward, the numbers of the following lines will change automatically. Sometimes it is necessary to calculate a bit beforehand which number will be the correct one.
Very important: When the author writes an increasing line from left to right – which happens very, very often – and when the baseline is split on the LA, the second half of the split BL will have the smaller number. If you want to merge these baselines with the Merge Tool, you have to look at the RO first. If the RO is wrong, Transkribus will merge it with a loop according to their coordinates. This baseline can no longer be interpreted by the HTR.
Edit: This problem was solved with the version 1.8.0. The problem now only occurs with vertically recognized lines.

Posted by Anna Brandt on

Toolbar – the most important tools and how to use them #1

Release 1.7.1

Creating Layouts

This is how the toolbar looks like with a new image. After you have run the CITlab Advanced LA, the other tools will be enabled. If the layout is to be done manually, the two tools in the upper circles are particularly important. TR means text region. This is the first layout element that has to be created for a page. It defines which areas of the image have text and which do not. If the text does not fit correctly into a text region, you first roughly draw the TR and later adjust it. Then you can draw the baselines with “BL”. Among the lower tools, only the green, semicircular arrow is important. This is the “undo”-function; as the name suggests, it is used to undo actions.

Tips & Tools
“Item visibility” is a function that makes structure of the document more transparent for you. If it is enabled, a box appears in which you can select what items should be visible in the current image. Textregions and Baselines are the most important elements, not only while editing the layout, but also during the later transcription. These two boxes are always checked in the default setting. If the display of the Baselines annoys you, you should deactivate it manually. Another important feature for correcting the layout is the Lines Reading Order, i.e. the order in which the lines are read later by the HTR. When the Reading Order is displayed, you can easily see whether the layout analysis has worked reliably. However, this display is mostly distracting while transcribing. In this case you should hide it again.

Posted by Anna Brandt on

Baselines

Release 1.7.1

The Baseline is the most important reference point for text recognition. The segmentation of a text into lines can in most cases be done automatically with the help of CITlab Advanced LA. However, there might be cases where you either immediately decide to draw the baselines manually or at least want to make manual corrections. Here are a few practical tips:
The baseline should always be positioned exactly under the “middle band” of the line, i.e. where “a” “o” “m” “v” etc. touch the base.
If you add the baseline manually which you can do very quickly with a little practice, you should never move too far from the bottom of the characters (not further than one or two linewidths of the writing) no matter in which direction. The baseline consists of individual points that you set yourself when adding manually; the setting is completed with a double-click or Enter on the last point. Baselines can also be drawn vertically. In an image and even a text region, you can also combine different line directions (e.g. the typical “postcard layout”).

Problems with automatic line detection occur frequently when either the word spacing varies significantly or becomes particularly large, or if the line orientation is changed (curved lines). In such cases, the Baseline may be split into subsections containing individual words. This has no consequences for the text recognition and thus for the later full text search, because the entire text can still be captured. However, those who value a perfect layout of their full text that reflects the original text must correct this. The correction of the Baselines is not always necessary, but you have to pay attention to the Reading Order, otherwise uncertainties may arise in the later transcript. Such “torn” Baselines can be merged again easily with the Merge-Tool.


Tips & Tools
What if the text is upside down?
The CITlab Advanced LA cannot correctly capture the Baseline of an upside down line. Baselines always work in the reading direction. If you want to detect upside-down lines or set them manually, you either have to rotate the image or draw the Baseline at the top of the middle band (against the reading direction) from right to left. In both cases, Transkribus will rotate the image during transcription in the readable direction.

Posted by Anna Brandt on

Textregions

Release 1.7.1

Usually, the automatic CITlab Advanced Layout Analysis in its standard setting will recognize a single Text Region (TR) on an image with the corresponding baselines.
However, there are also simple layouts where the use of several TRs is recommended, e.g. if there are marginal notes or footnotes and similar recurring elements. As long as these text areas, which differ in content and structure, are contained in a single TR, the layout analysis simply counts the lines from top to bottom.

This “Reading Order” does not take into account where a text actually belongs in terms of content (e.g. an insertion), but only where it is graphically located on the page. Correcting an automatically generated but unsatisfactory Reading Order is boring and often time-consuming. The problem can easily be avoided by creating several text regions in which the related texts and lines are well kept like in a box.
To do this, you create the TRs manually at the appropriate places. Afterwards start the line detection with CITlab Advanced to add the baselines automatically.

Tips & Tools
If you have drawn the TRs manually and want to have the baselines drawn automatically by CITlab Advanced LA, you should first uncheck the box “Find Textregions”. Otherwise the manually drawn TRs will be replaced immediately. You should also make sure that none of the individual text regions is activated, otherwise only these will be edited.

Posted by Anna Brandt on

Elements

Release 1.7.1

For handwritten text recognition (HTR), automatic layout analysis is essential – no text recognition without layout analysis.
The layout analysis ensures that the image is divided into different areas, those that do not need further attention and others that contain the text to be recognized. These areas are called “Text Regions” (TR, green in the image). Transkribus needs “Baselines” (BL, red in the image) to recognize characters or letters within the text regions.
They are drawn underneath each text line. Baselines are surrounded by their own region, which is called “Line” (blue in the image). It has no practical relevance for the user. The three elements Text Region – Line – Baseline have a parent-child relationship to each other and cannot exist without the respective parent element – no baseline without line and no line without text region. One should know these elements, their functions and their relationship to each other, especially if you have to work on the layout manually.

Manual layouts should rather be an exception than the rule. For most use cases, Transkribus has an extremely powerful tool – the “CITlab Advances Layout Analysis”. It is the standard Transkribus model that has been used successfully since 2017. In most cases it delivers great results in automatic segmentation. This automatic layout analysis can be used for a single page, a selection of pages or an entire document.

All elements for segmentation can also be set, modified and edited manually, which is recommended in more complex layouts. An extensive toolbar is available for this purpose.